

Introduction
In this article, we will be discussing a recent project that aimed to create an Android mobile application for COVID-19 awareness and statistics. The application provides users with up-to-date information on the latest statistics, vaccine information, and risk of infection in Morocco. Additionally, the app also features a machine learning model that uses decision tree algorithm to predict the risk of infection. The project was developed using Kotlin, MVVM architecture, Coroutines, Retrofit, and MPAndroidChart.
Architecture and Data Handling
In this project, we used MVVM (Model-View-ViewModel) architecture to separate the UI and the business logic of the application. The ViewModel acts as a bridge between the View (UI) and the Model (data) and is responsible for handling the data and providing it to the View.
On the data side of the project, we used Retrofit to fetch data from the API and Coroutines to handle the asynchronous nature of the network calls. Retrofit is a popular library for making HTTP requests in Android and it allows for easy integration with the API. By using Retrofit, we were able to define the API endpoints and the data models in a clear and organized way.
To handle the data persistence, we used Room, an SQLite database library that is part of the Android Architecture Components. Room provides an abstraction layer over SQLite, making it easier to work with databases in Android. We used Room to store the data locally and to provide the data to the ViewModel.
To manage the communication between the different layers of the application (ViewModel, Repository, Room, and Retrofit) we used the Repository pattern. The Repository class acts as a single source of truth for the data and is responsible for managing the data flow between the different layers. The Repository class fetches the data from the API using Retrofit and stores it in the Room database. It then provides the data to the ViewModel, which in turn provides it to the View.
We also used Coroutines, which is a Kotlin library for handling concurrency and asynchronous operations. Coroutines allows you to write asynchronous code that looks and behaves like synchronous code. By using Coroutines, we were able to handle the network requests and database operations in a more efficient way, which improved the performance of the application.

MVVM mdel with retrofit
In summary, we used MVVM architecture to separate the UI and the business logic, Retrofit to fetch data from the API, Room to store the data locally and provide it to the ViewModel, and Coroutines to handle the asynchronous operations. The Repository class managed the communication and data flow between these different components and ensured that the data was always consistent and up-to-date.
When the application starts, the ViewModel fetches the data from the Repository, which in turn fetches the data from the Room database. If the data is not available in the Room database, the Repository makes a network call using Retrofit to fetch the data from the API. Once the data is received, it is stored in the Room database and provided to the ViewModel.
The use of Coroutines in the Repository class ensured that the network calls and database operations were handled in a non-blocking way, which improved the performance of the application. By using Coroutines, we were able to perform multiple operations simultaneously, which reduced the overall time required to fetch and process the data.
By using these different technologies and patterns, we were able to create an application that was efficient, performant, and easy to maintain. The MVVM architecture made the code more organized and easier to understand, while the use of Retrofit, Room, Coroutines, and the Repository pattern ensured that the data was always up-to-date and consistent.

courotines with live data
MPCHART
Next, we focused on the data side of the project. We used Retrofit to fetch data from the API and Coroutines to handle the asynchronous nature of the network calls. We also used the gson library to deserialize the JSON data into Kotlin objects.
Once we had the data, we used MPAndroidChart to create various types of charts such as line charts and bar charts to visualize the data. We also used the machine learning model based on decision trees algorithm to predict the risk of infection.

Throughout the development of the project, we faced several challenges, such as handling the large amounts of data, implementing the machine learning model and creating a user-friendly interface. However, we were able to overcome these challenges by using the right tools and techniques.
Machine Learning Model
To build the machine learning model, we used Python and Scala, and we trained the model using a dataset on the decision tree algorithm. We also used various open-source libraries and resources such as scikit-learn and pmml4s. One of the main challenges we faced was the accuracy of the model and we were able to improve it by fine-tuning the parameters and by using a large dataset.
Design and User Experience:
in addition to the technologies and patterns mentioned previously, we also used the Fragment technology in this project. Fragments are a part of the Android framework that allows for the creation of reusable and modular UI components. We used fragments to create the different screens of the application, such as the home screen, the statistics screen, and the risk assessment screen.
We used a Bottom Navigation Bar to navigate between the different fragments. This is a common navigation pattern in Android that allows users to easily switch between different screens of the application. The Bottom Navigation Bar contains a series of icons that represent the different screens, and by clicking on one of the icons, the user is taken to the corresponding fragment.
Using fragments allowed us to create reusable and modular UI components, which made the code more organized and easier to maintain. By using the Bottom Navigation Bar, we were able to create a simple and intuitive navigation system that made it easy for users to switch between different screens of the application.

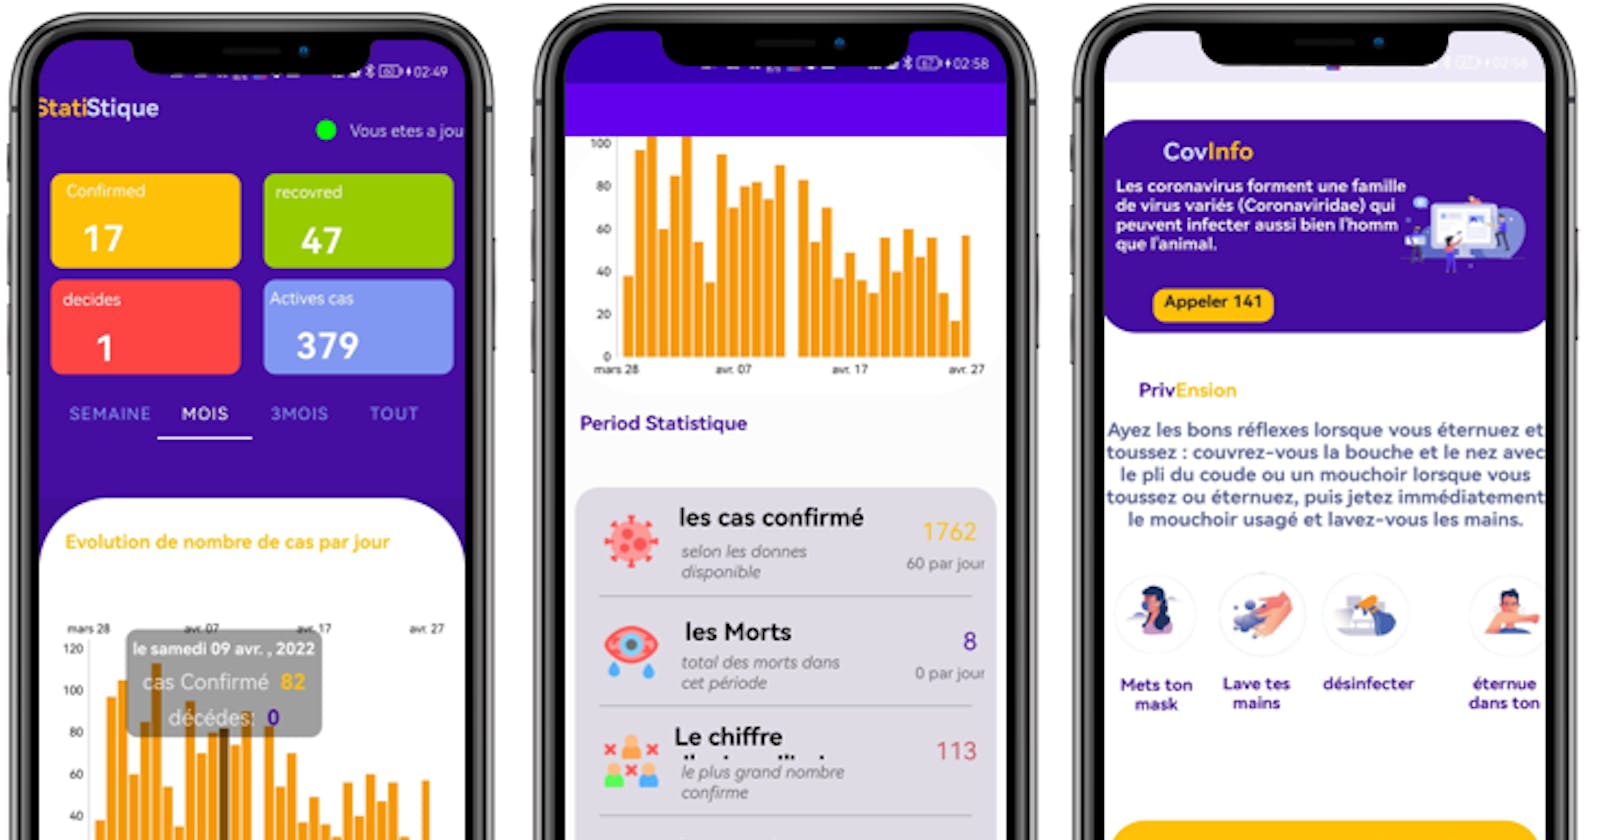
Covid statistics Application
In summary, we used the Fragment technology to create reusable and modular UI components and the Bottom Navigation Bar to navigate between the different fragments, this help to create a simple and easy to use interface for the user . This combination of technologies and patterns allowed us to create an application that was easy to navigate and provided a consistent user experience.
Conclution
Overall, this project is a great example of how technology can be used to combat a global pandemic. By using mobile technology and machine learning, we were able to create an application that provides users with up-to-date information and helps them make informed decisions. We hope that this article provides a detailed understanding of the project and that it will inspire others to use technology to make a positive impact on the world.
References
To develop our application and machine learning model, we used several resources, including :
...with up-to-date information and helps them make informed decisions. We hope that this article provides a detailed understanding of the project and that it will inspire others to use technology to make a positive impact on the world.
References
To develop our application and machine learning model, we used several resources, including:
- Android development documents (developer.android.com/docs)
- Kotlin documentation (kotlinlang.org/docs/android-overview.html)
- AndroidX libraries (developer.android.com/jetpack/androidx/expl..)
- Tutorials on MVVM architecture on Android (medium.com/androidmood/comprendre-larchitec..)
- Documentation on Kotlin coroutines (developer.android.com/kotlin/coroutines)
- The COVID-19 statistics API for Morocco (api.covid19api.com/dayone/country/Morocco)
- Research articles on COVID-19 (nature.com/articles/s41746-020-00372-6)
- An open-source project on GitHub (github.com/nshomron/covidpred)
- A networking library for Android (square.github.io/retrofit)
link to the projet in github : github.com/soufianesejjari/covInfo