Data Visualization from oltp to olap with Power BI and ETL with Talend


Table of contents
Introduction
In today’s data-driven world, it’s more important than ever to be able to make sense of large and complex datasets. This is where data visualization and ETL come in. Data visualization is the process of creating graphical representations of data in order to communicate information more effectively. ETL, or extraction, transformation, and loading, is the process of moving data from one or more sources to a destination where it can be analyzed and used to make data-driven decisions.
In this blog post, we will be discussing a project that combines both data visualization and ETL. The project involves the creation of a data visualization dashboard using Power BI and the extraction, transformation, and loading (ETL) of data from an OLTP MySQL database to an OLAP MySQL data warehouse using Talend. The OLTP (Online Transaction Processing) database contains transactional data, such as sales and customer information, while the OLAP (Online Analytical Processing) data warehouse stores data in a denormalized and optimized form for faster querying and analysis.
The main goal of this project is to provide users with a simple and interactive way to understand the data and make informed and data-driven decisions. The dashboard will be designed with a clean and modern look that is easy to read and navigate, using a combination of charts, tables, and maps. The users will be able to interact with the data by using various filtering and slicing capabilities.
In this blog post, we will be discussing the data sources, the ETL process, the data visualization with Power BI and the design details of the project. We will also show some screenshots of the final dashboard and explain the key features and benefits of the project.
Data sources
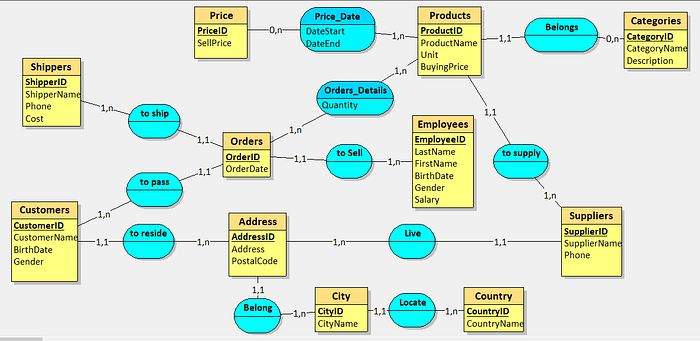
The data sources used in this project are an OLTP MySQL database and an OLAP MySQL data warehouse. The OLTP database contains transactional data, such as sales and customer information. It is typically used to store data that is constantly changing and needs to be accessed quickly, such as in a retail or e-commerce scenario. The data in this database is usually normalized, which means it is stored in multiple tables to reduce data redundancy and improve data integrity.
The destination of the ETL process is the OLAP MySQL data warehouse, which stores data in a denormalized and optimized form for faster querying and analysis. The data in this database is typically used for reporting and analysis, such as in a business intelligence or data mining scenario. The data in this database is usually stored in a star or snowflake schema, which allows for faster querying at the cost of increased data redundancy.
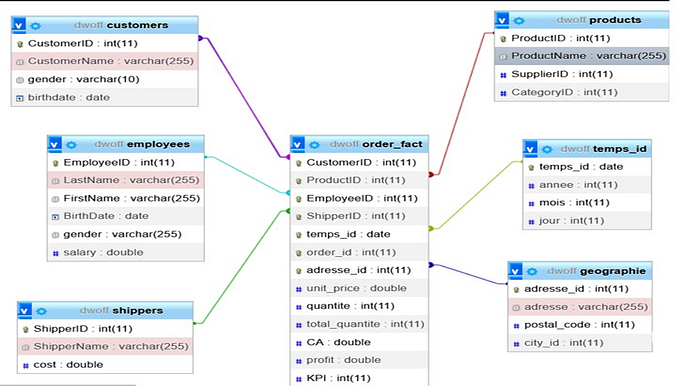
OlAP start SCHEMA
The main idea behind the ETL process is to move the data from the transactional OLTP database to the analytical OLAP data warehouse. The data is extracted from the source database, transformed to fit the format of the data warehouse and then loaded into the data warehouse. This allows the data to be queried and analyzed more efficiently and effectively, which in turn helps to make data-driven decisions.
The ETL process
The ETL process is a critical component of the project, as it is responsible for moving data from the OLTP MySQL database to the OLAP MySQL data warehouse. Talend is an open-source ETL tool that allows developers to easily extract, transform, and load data. It provides a wide range of pre-built connectors and components, making it easy to connect to various data sources and destinations.

ETL process
The ETL process using Talend can be broken down into the following steps:
Connect to the source OLTP MySQL database and the destination OLAP MySQL data warehouse: Talend provides connectors for both MySQL databases, allowing you to easily connect to them and extract data.
Extract the relevant data from the source database: Talend allows you to extract data from the source database using SQL queries. You can also filter and sort the data as needed to extract only the data that is relevant to your analysis.
Transform the data: Talend provides a wide range of data transformation components, such as sorting, filtering, and aggregating. You can use these components to manipulate the data in order to fit the format of the data warehouse.
Load the transformed data into the destination data warehouse: Talend allows you to load the transformed data into the destination data warehouse using its data loading components.
Set up a scheduling system: Talend allows you to set up a scheduling system to automate the ETL process on a regular basis. This way, you can ensure that your data warehouse is always up-to-date with the latest data from your OLTP database.

Ectrait of tmap process
The Talend platform also allows to create jobs and workflows, that can be executed in batch or real-time, also it has a large library of connectors and pre-built job templates, making it easy to create and manage ETL processes, even for complex data integration projects.
Data visualization with Power BI
Data visualization with Power BI is an essential part of this project, as it allows users to interact with the data and gain insights that would be difficult or impossible to see in raw form. Power BI is a powerful data visualization tool that provides a wide range of features for creating interactive and engaging visualizations.

Here are some key features of Power BI that were used in this project:
Drag-and-drop interface: Power BI’s drag-and-drop interface makes it easy to create visualizations such as charts, tables, and maps. You can simply select the data and the type of visualization you want to create, and Power BI will do the rest.
Formatting options: Power BI provides a wide range of formatting options, such as colors, fonts, and layouts, allowing you to customize the appearance of your visualizations to match your brand or style.
Filtering and slicing capabilities: Power BI allows users to interact with the data by using various filtering and slicing capabilities. This makes it easy to explore different perspectives and gain new insights from the data.
Dashboard and report: Power BI also provide a feature of creating a dashboard and reports, that can be shared with other users, and they can interact with the data and explore the insights by themselves.
The design of the project also played an important role in making the dashboard easy to read and navigate. A clean and modern look was used, with a focus on readability and ease of use. The dashboard was designed to be highly interactive, with the ability to filter and slice the data in real-time. Contextual information and captions were also included to help users understand the data and its implications.
In addition to the design, the project also took into consideration the user experience, making sure that the dashboard is easy to use and understand, with clear and concise labeling and intuitive navigation.

PowerBi exrait visualisaion
In conclusion, this project demonstrates the power of data visualization and ETL in creating insights and understanding from large and complex datasets. By using tools such as Power BI and Talend, we were able to transform raw data into meaningful and actionable information that can be used to drive business decisions. The project also emphasizes on the design and user experience, that makes the dashboard easy to use and understand.
We hope that this project will be a valuable resource for our users, and that it will help them to make informed and data-driven decisions. If you would like to see the final dashboard or explore the code of the project,
you can visit my portfolio at [soufiane-s]
or you can access the project in my Github repository at [github link].