Streamlining Data Collection and Analysis: Our Experience Using the Google Forms API and Python


Introduction
Data visualization and processing are essential tools in today’s data-driven world. They allow us to extract insights and understanding from large and complex datasets, and to make informed and data-driven decisions. In this blog post, we will take a closer look at a project that combines different technologies and tools for data visualization and processing, using Python, SPSS, Talend, Streamlit, Google Forms, and an API.
First
The goal of this project was to create a web application that allows users to visualize and analyze data collected from a Google Form questionnaire. The data was first extracted and transformed using Talend, and then analyzed using Python and SPSS. The results of the analysis were visualized using a web application built with Streamlit. The application allows users to interact with the data in various ways, such as exploring different aspects of the data, such as trends and correlations, through various chart types and interactive features. We also used an API to retrieve responses from the questionnaire and integrate them into the analysis.
This introduction sets the context of the project and explain the goal of the project and the main technologies that have been used and it give an idea about the main components of the project and the readers will know what to expect from the post. Then the first paragraph give more details about the process that you have followed in the project and the different steps of the process and the main components of the application, which will help the reader to understand more about the project.
Data Extraction and Transformation with Talend
The first step in the project was to extract the relevant data from the source Google Form questionnaire and transform it into a format that can be analyzed and visualized. To do this, we used Talend, an open-source ETL (Extract, Transform, Load) tool. With Talend, we were able to connect to the Google Form API, extract the data, and then perform various operations on the data such as sorting, filtering, and aggregating. Once the data was cleaned and prepared, we loaded it into a MySQL OLAP data warehouse for further analysis.
Data Analysis with Python and SPSS
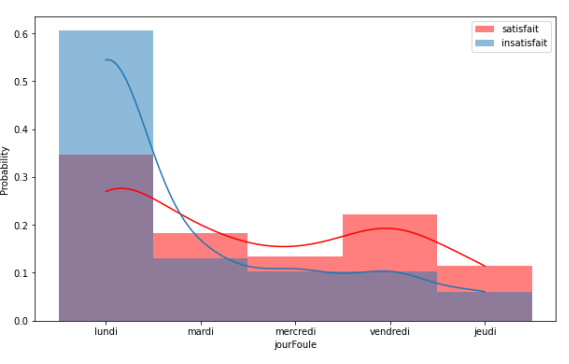
The next step in the project was to analyze the data and create insights. We used both Python and SPSS for this purpose. Python was used for data cleaning, data preparation and data visualization using libraries such as pandas, numpy, and matplotlib. SPSS was used for statistical analysis, such as descriptive statistics and inferential statistics. This allowed us to extract meaningful insights from the data, such as correlations and trends, which were then used to create visualizations for the web application.

Web Application Development with Streamlit
The final step in the project was to create a web application that allows users to interact with and explore the data. To do this, we used Streamlit, an open-source Python library that allows you to easily create web applications. With Streamlit, we were able to create a user-friendly interface that allows users to explore different aspects of the data, such as trends and correlations, through various chart types and interactive features. The application also includes contextual information and explanations to help users understand the implications of the data.
This addition will give more details about the development process, the different steps and the different tools that you have used, it will also give an idea about the main functionalities of the application. It will give the reader an idea about the main challenges that you have faced during the project development and the solutions that you have adopted.
Another aspect of this project was the use of the Google Forms API to connect a Google Form with a Python code using the gspread library. This allowed us to collect data from users through the Google Form and then use the collected data in our Python code to create the visualizations and perform the ETL process.
To connect the Google Form with the Python code, we first had to set up the form and configure it to send the collected data to a Google Sheet. Once the form was set up, we used the gspread library, which is a Python client library for the Google Sheets API, to access and manipulate the data in the Google Sheet.
Using the gspread library, we were able to authenticate with the Google Sheets API using a service account, which allowed us to access the data in the sheet without the need for user authentication. We also used the library to access the data in the sheet, read the data into a pandas dataframe and perform the necessary ETL and data manipulation process before feeding it to the visualization step.

Once the data was loaded into the data warehouse, we used Python and relevant libraries such as pandas and matplotlib to create data visualizations. We used Python's data manipulation and visualization capabilities to create plots, charts, and tables. We also customized the appearance and layout of the visualizations using Python's formatting options. We also made use of Python's interactive features to allow users to explore and analyze the data in different ways.

Throughout this project, we paid special attention to the design of our visualizations, using a clean and modern look that is easy to read and understand. We made sure to choose colors and styles that were appropriate for the data and the message we wanted to convey. We also included relevant contextual information and captions to help users understand the data and its implications. Additionally, we made sure to test and iterate on the visualizations to ensure that they were easy to use and understand for the intended audience.
Another important aspect of this project was the use of Streamlit, an open-source Python library that allows for easy creation of web-based data visualization dashboards. We used Streamlit to create an interactive and user-friendly web application that could be used to access and explore the data visualizations we created.
Using Streamlit, we were able to create an intuitive and easy-to-use interface for the visualizations, allowing users to interact with the data in various ways. For example, we created sliders and dropdown menus that allowed users to change the parameters of the visualizations, such as the time range or the variables being displayed. We also implemented other features such as buttons, text inputs and checkboxes to make the user experience as smooth as possible.
The use of Streamlit also provided the ability to deploy the application easily and share it with others, without the need for any complex setup or hosting requirements. This made it easy for stakeholders and other users to access the visualizations and explore the data, regardless of their location or technical expertise.

Conclusion
In this project, we demonstrated the power of data visualization and processing by creating a comprehensive and user-friendly web application that allows users to explore and understand data collected from a Google Form questionnaire. By using tools such as Talend, Python, SPSS, Streamlit, and an API, we were able to extract, transform, analyze and visualize data in meaningful and actionable way.
We hope this project will be a valuable resource for our users and that it will help them to make informed and data-driven decisions. If you’re interested in exploring the code,
you can find the source code on our GitHub repository: [projet code source].
And if you want to see more of our work, you can check out our portfolio**website: [soufiane sejjari].